- About ECU
Welcome to ECU
ECU offers innovative and practical courses across a variety of disciplines and we have a vibrant research culture. ECU is a leader in developing alternative entry pathways to higher education.
- Continue on to About ECU
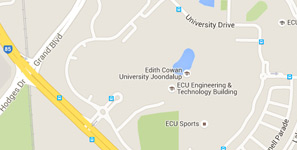
Our campusesWe have three campuses in Western Australia. Joondalup and Mount Lawley in the Perth metropolitan area and our South West campus in Bunbury, 200km south of the Perth CBD.
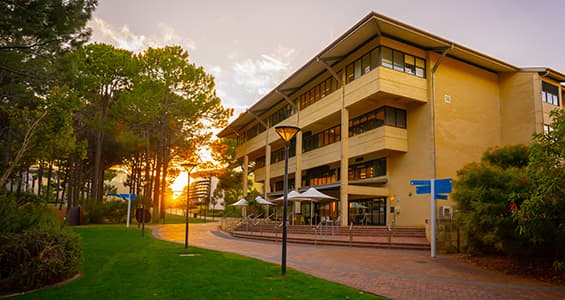
Campus facilitiesECU provides a variety of services and facilities that go beyond the classroom, with opportunities for personal development and social interaction for students and staff.
- Study
Browse courses by study area
- Arts & Humanities
- Business & Law
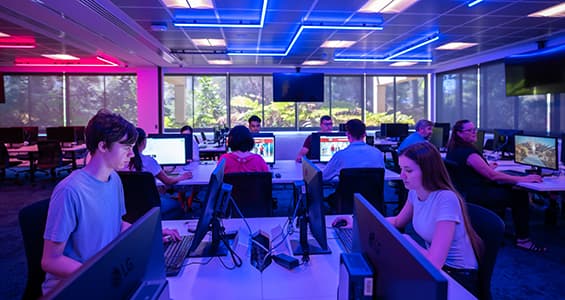
- Engineering & Technology
- Medical & Health Sciences
- Nursing & Midwifery
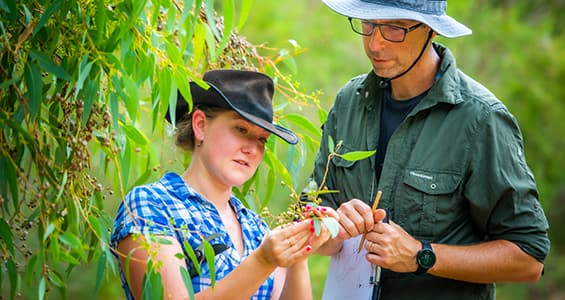
- Science
- Teacher Education
- Western Australian Academy of Performing Arts
- Course entry
- Fees and scholarships
- Applying for courses
- Early Offer Program
- Mid-Year study
- Year 12 Pathways
- Important dates
- Events for future students
- Life on campus
- Short courses
- Continue on to Study
Browse courses by study typeInternational studentsContact usIn Australia
International
- Research
Our Research
At ECU we concentrate our research in areas of strength to deliver tangible outcomes.
- Continue on to Research
How to get involvedThere are several ways to get involved with research at ECU.
Graduate researchECU has a lively research community that is committed to supporting research students.
Supporting researchersResearch Services provides comprehensive support services to researchers.
- Industry
Research
We value industry partnerships and offer access to world-class research across our nine ECU Strategic Research Institutes and Centres.
ECU links our stakeholders to our professional talent pool across a range of disciplines and research topics.
- Continue on to Industry
Partner with usWe collaborate with all types of businesses, including new start-ups, small to medium enterprises, not-for-profits, community organisations, government and large corporates in the resources sector.
Professional developmentECU delivers training that can be tailored to industry needs.
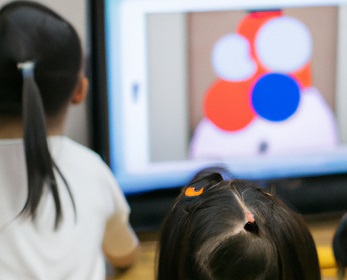
Extra-curricular learning for childrenChildren's University Edith Cowan aims to inspire students between seven and fourteen to develop confidence and a love of learning through validated activities beyond the school curriculum.
Contact our team- Call us on 134 328
- Complete our enquiry form
- Alumni and Supporters
Inspiring Minds Scholarships Fund
The Inspiring Minds scholarship program are equity scholarships that give students an opportunity to access an education that may otherwise be out of reach.
EventsCatch up with fellow graduates at one of our regular alumni events.
- Continue on to Alumni and supporters
Get involvedWe love to see our graduates back at ECU helping current students achieve their dreams.
Stay in touchTell us what you've been up to since you graduated or stay in the alumni loop.
Professional developmentTake advantage of a range of career development or other alumni benefits.